Fig. 2.

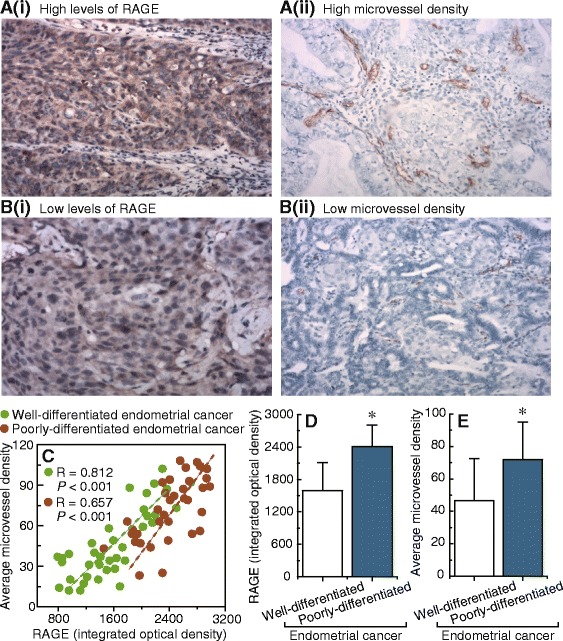
Correlation between RAGE expression and microvessel density in endometrial cancer samples. a and b, examples of immunostaining showing the positive correlation between the expression levels of RAGE and microvessel density in 72 endometrial cancer tissue samples. a(i) and a(ii), high RAGE levels and high microvessel density. b(i) and b(ii), low RAGE levels and low microvessel density. Magnification is 100× for a(i) and b(i), 200× for a(ii) and b(ii). c, correlation between RAGE expression and microvessel density in well-differentiated and poorly-differentiated endometrial cancer tissues, respectively. d, summary of the results obtained from the measurements shown in a(i) and b(i). E, summary of the results obtained from the measurements shown in a(ii) and b(ii). Bar graphs display mean ± SD. * P < 0.05 vs. control
