
Fig. 2.
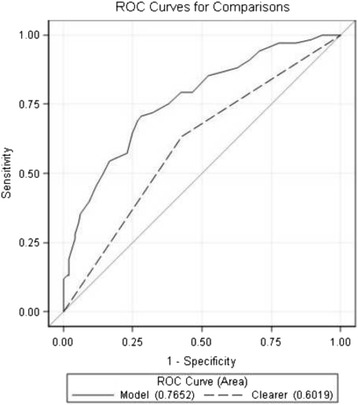
Shows the ROC curve and comparison for the optimal clearance divisor value (25.89 %) and the median clearance value (31.60 %). The figure shows that the two values (25.89 %; 31.60 %) have roughly the same area under the curve (not significantly different using linear discriminant analysis). Since the two values (25.89 and 31.60 %) perform similarly, we were confident in our ability to use the median clearance value, 31.60 %, as our cutoff to divide the two groups of patients (clearers and nonclearers)