Fig. 4.

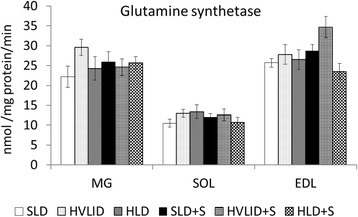
Glutamine synthetase. Means ± SE, p ˂ 0.05. *compared to the corresponding control (SLD or SLD + S); # compared to the corresponding fed group; † HLD (HLD + S) group vs. HVLID (HVLID + S) group

Glutamine synthetase. Means ± SE, p ˂ 0.05. *compared to the corresponding control (SLD or SLD + S); # compared to the corresponding fed group; † HLD (HLD + S) group vs. HVLID (HVLID + S) group