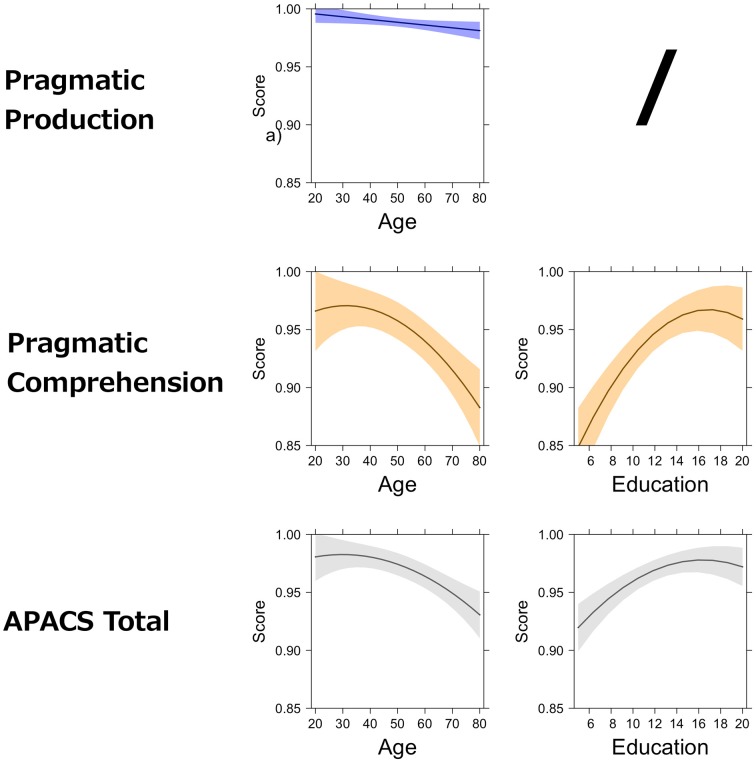
Figure 3.
Effect of demographic variables on APACS composite scores. The figure shows the partial effects of age and education on APACS composite scores, as estimated by regression analysis. The figure is an array displaying the APACS composite scores (first column) and the effect of age (second column) and education (third column). A slash (“/”) indicates that the effect was not significant in the regression analysis. The black line in each plot represents the predicted score at the APACS composite score. The colored bands around the line represent point-wise confidence bands around the prediction. Light blue is used for the Pragmatic Production score. Light orange is used for the Pragmatic Comprehension score. Gray is used for the APACS Total score.

