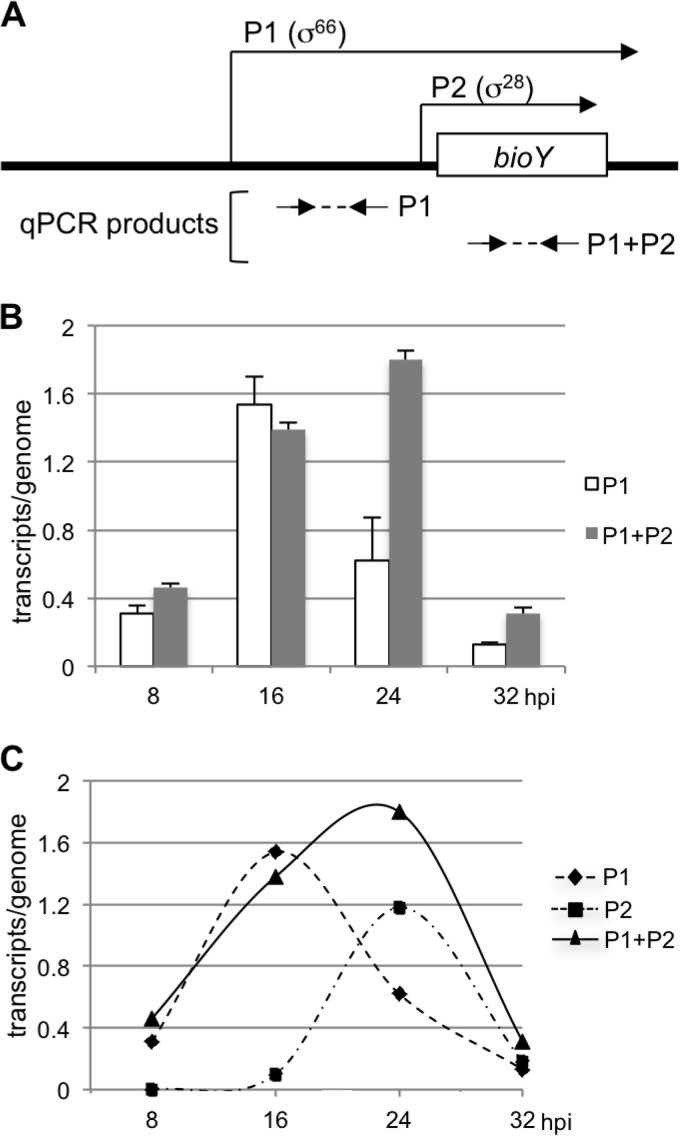
FIG 5.
qRT-PCR measurements of bioY transcript levels during the developmental cycle. (A) Diagram showing the relative locations of the primer pairs (arrows) used to amplify cDNA from P1 alone and total cDNA from P1 and P2 (the diagram is not to scale). (B) Graph showing qRT-PCR transcript levels normalized to genome copy number. For each time point, cDNA was generated from RNA and was used in a qPCR with primers to measure transcript levels from P1 alone or total transcript levels from P1 and P2. Genome copy numbers were calculated at each time point with the same sets of primers. Values are averages of triplicate qPCR measurements, with standard deviations being indicated by error bars. (C) Graph showing overall and promoter-specific transcription of bioY. Transcript levels for P1 and P1 plus P2 are from the qRT-PCR measurements shown in panel B. Transcript levels for P2 for each time point were calculated by subtracting P1 transcript levels from overall P1 plus P2 transcript levels. At 8 hpi, the P1 plus P2 transcript level was slightly higher than the P1 transcript levels, and so the level for P2 was set equal to 0.

