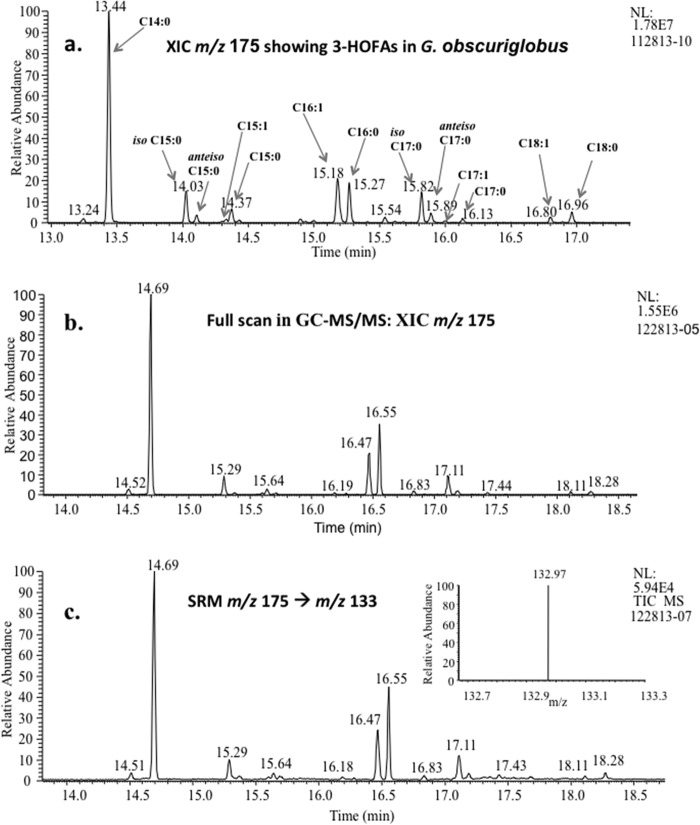
FIG 3.
(a) Identified 3-HOFAs in G. obscuriglobus with combined GC and MS data. Analysis was performed using the single-quadrupole GC-MS with XIC of m/z 175 for G. obscuriglobus treated by the Komagata-Suzuki method (46) with identified peaks produced by GC-MS. (b and c) Analysis performed using the triple-quadrupole GC-MS/MS, with the chromatograms comparing 3-HOFA distributions in G. obscuriglobus cells by full-scan GC-MS/MS (b) and GC-MS/MS in SRM mode (c). The inset in the chromatogram represents the SRM mass spectrum, showing a peak at m/z 133. NL, neutral loss.

