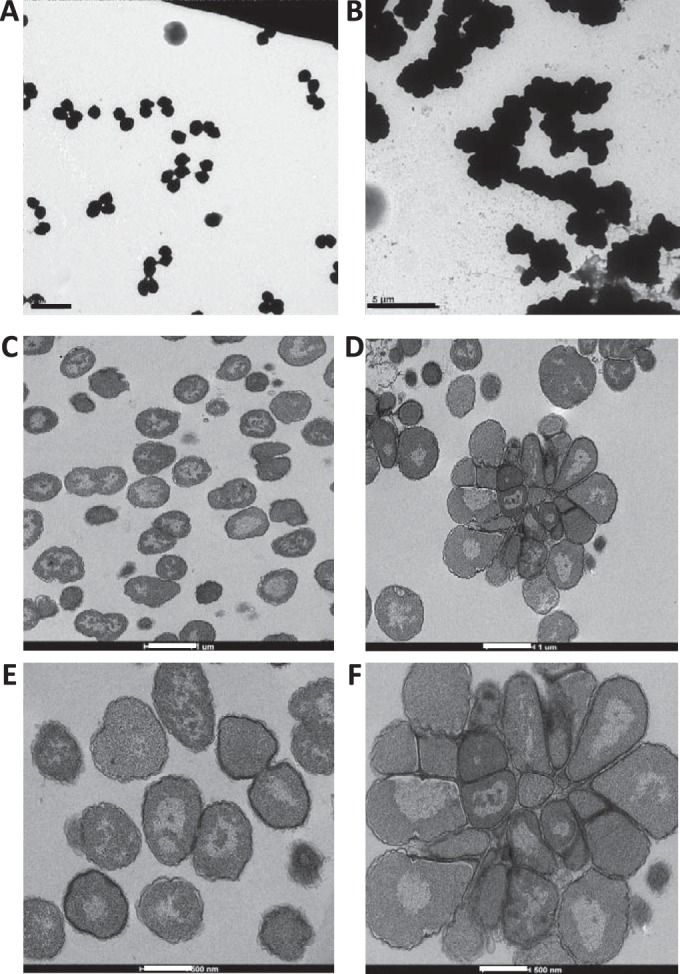
FIG 3.

Inactivation of nlpD affects cell separation. (A and B) Representative transmission electron micrographs (TEM) of whole-cell mounts of FA1090nv and the ΔnlpD mutant. Thin-section TEM images show complemented strain ΔnlpD::nlpD with IPTG (C and E) and without IPTG (D and F). Cells not expressing nlpD grow as large aggregates (B, D, and F), whereas the parental strain and complemented strain expressing nlpD grow as either monococci or diplococci (A, C, and E). The scale bars are as follows: 2 μm (A), 5 μm (B), 1 μm (C and D), and 500 nm (E and F).
