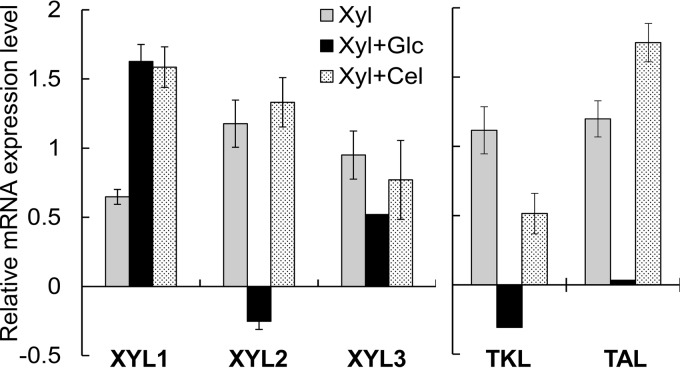
FIG 3.
Relative mRNA expression levels (in log2 scale) of the xylose pathway (XYL1, XYL2, and XYL3) and pentose phosphate pathway (TKL and TAL) genes of the parent Y. lipolytica strain for growth on xylose (Xyl), a mixture of xylose and glucose (Xyl+Glc), and a mixture of xylose and cellobiose (Xyl+Cel). The reference condition for normalization is growth on glucose alone. Each data point represents an average value ± 1 standard deviation calculated from the results of 4 biological replicates.

