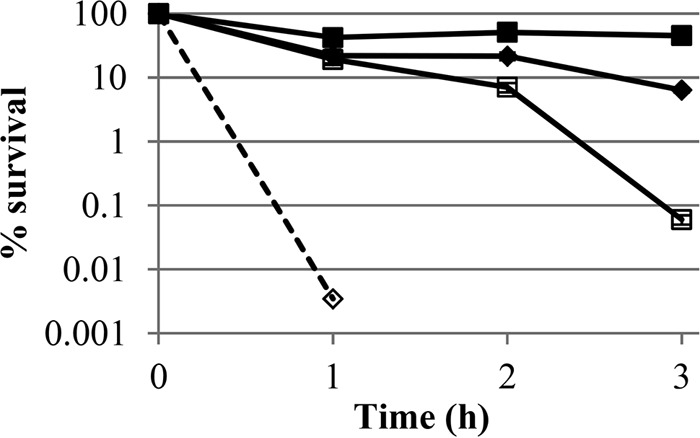
FIG 2.

Sensitization of B. subtilis spores (strain PS533) to killing by PAA or H2O2. Symbols represent mean values (n = 3), and error bars represent the standard deviations of the means. Spores were either pretreated with PAA (0.05%; □) or H2O2 (1%; ♢), to give an approximately 90% (1 log) kill, or underwent no pretreatment (◆ and ■). Following pretreatment, microbicides were neutralized thoroughly, and the spores were treated with either PAA (0.05%; ◆ and ♢) or H2O2 (1%; ■ and □). The dashed line represents a data point which fell below the limit of detection at the time indicated. Spores used in this experiment were prepared independently from those used for Fig. 1 but are the same as those used for Table 4.
