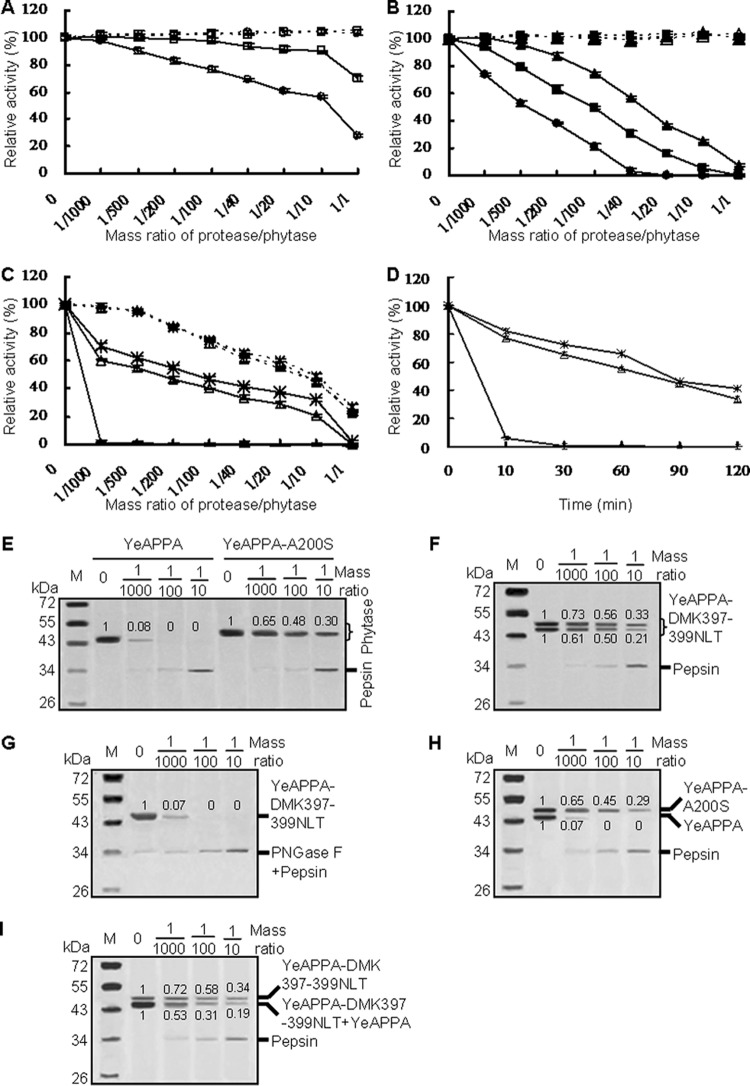
FIG 3.
Proteolytic resistance of N-deglycosylated and N-glycosylated phytases produced in P. pastoris. (A to C) Evaluation of resistance to pepsin at pH 2.0 (full lines) and trypsin at pH 7.0 (dotted lines) at various protease/phytase mass ratios and 37°C for 2 h. (D) Time course of resistance to pepsin at the pepsin/phytase mass ratio of 1/40 over 2 h. For panels A to D, the phytase activity toward sodium phytate (1.5 mM) at 37°C for 30 min was regarded as 100%, and the residual activity is indicated as a percentage of activity of untreated enzymes, with means ± SDs from triplicate determinations. Symbols: □, YrAPPA; ○, YrAPPA-NLT397-399DMK; ■, YkAPPA; ▲, YkAPPA-D397N/K399T; ●, YkAPPA-S200A;  , YeAPPA-DMK397-399NLT; △, YeAPPA-A200S;
  , YeAPPA. (E to G) SDS-PAGE analysis of the proteolytic products of the wild-type and mutant YeAPPA and enzymatically N-deglycosylated YeAPPA-DMK397-399NLT by pepsin. (H and I) SDS-PAGE analysis of the proteolytic products of the phytase mixture of YeAPPA and YeAPPA-A200S or YeAPPA-DMK397-399NLT. The phytase band intensity was estimated by using ImageJ software.

