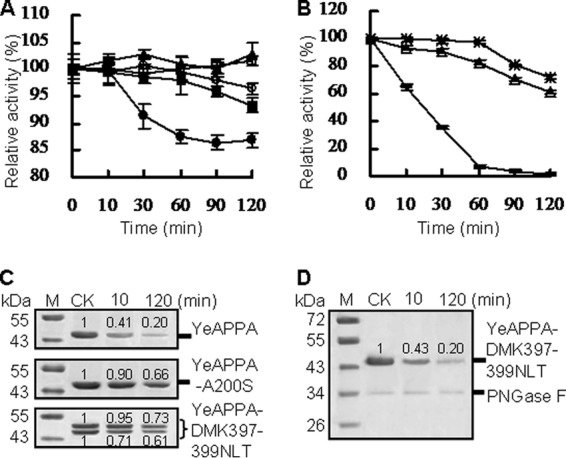
FIG 4.

Time course stability of N-deglycosylated and N-glycosylated phytases produced in P. pastoris at pH 2.0 and 37°C over 2 h. (A and B) Residual activities of phytases after acid treatment. For panels A and B, the 100% activity and residual activity were calculated as for Fig. 3; data are represented as means ± SDs. Symbols: □, YrAPPA; ○, YrAPPA-NLT397-399DMK; ■, YkAPPA; ▲, YkAPPA-D397N/K399T; ●, YkAPPA-S200A;  , YeAPPA-DMK397-399NLT; △, YeAPPA-A200S;
  , YeAPPA. (C and D) SDS-PAGE analysis of phytase stability after acid treatment. The phytase band intensity was estimated by using ImageJ software. The untreated phytases were used as the control.
