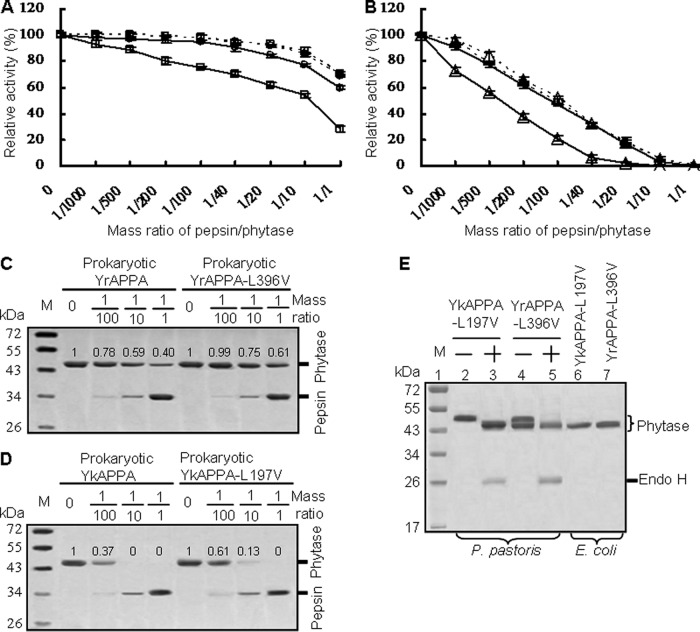
FIG 5.
Comparison of the pepsin resistance of YrAPPA and YkAPPA and their mutants produced in P. pastoris and E. coli at various pepsin/phytase mass ratios at 37°C and pH 2.0 for 2 h. (A and B) Pepsin resistance evaluation of phytases produced in P. pastoris (dotted lines) and E. coli (full lines). The 100% activity and residual activity were calculated as for Fig. 3; each point data is the mean from three replicates ± SD. Symbols: □, YrAPPA; ○, YrAPPA-L396V; △, YkAPPA;  , YkAPPA-L197V. (C and D) SDS-PAGE analysis of the proteolytic products of the E. coli-produced phytases degraded by pepsin at different ratios. The phytase band intensity was estimated by using ImageJ software. (E) SDS-PAGE analysis of the phytase variants YkAPPA-L197V and YrAPPA-L396V. Lanes: 1, protein marker (M); 2 to 4, the N-glycosylated YkAPPA-L197V and YrAPPA-L396V produced in P. pastoris before (−) and after (+) N-deglycosylation with endo H; 6 and 7, E. coli-expressed variants.

