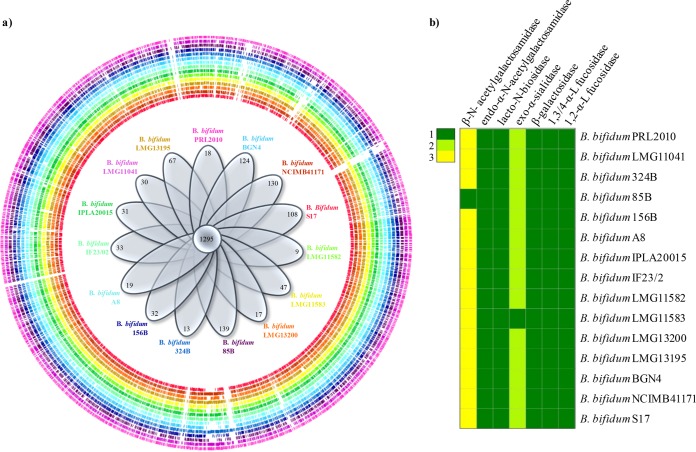
FIG 5.
The pan-genome of Bifidobacterium bifidum. Panel a shows a genome atlas representation of all publicly available genomes of the species B. bifidum in which each circle represents a different strain identified by a different color. Inside the genome atlas, a Venn diagram illustrates the number of identified core and unique genes. Panel b displays a heat map that summarizes the presence and number of particular genes predicted to be involved in mucin degradation in the analyzed B. bifidum genomes.

