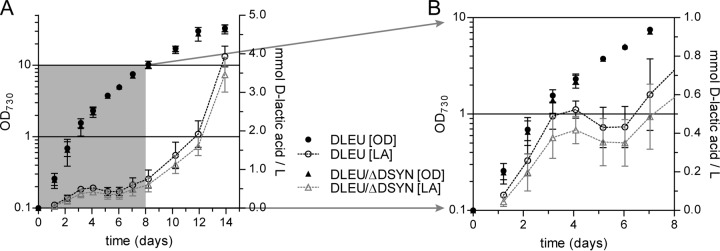
FIG 1.
(A) Time course of d-lactic acid (LA) production by a Synechocystis strain overexpressing d-LDH of L. mesenteroides (DLEU) solely or in combination with the slr1556 disruption strain (DLEU/ΔDSYN). (B) Closeup of data in panel A, allowing a detailed view of the changes in the d-lactic acid concentration during the early growth phase. Error bars indicate the standard deviations (SD) (n = 3) of results from biological replicates; where error bars are not visible, they are smaller than the data point symbol.

