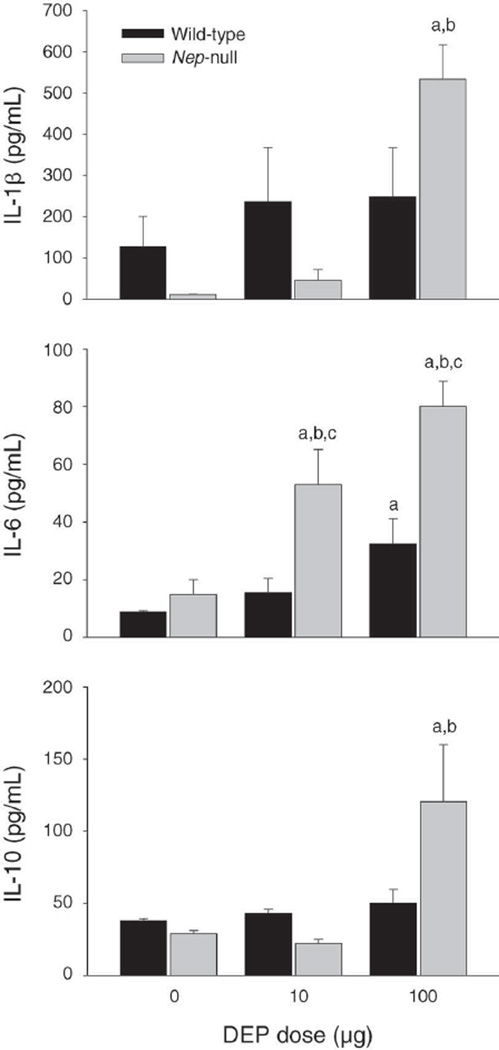
Figure 1. Differences in the amounts of cytokines IL-1(3, IL-6, and IL-10 in BAL fluid of C57BL/6 wild-type mice and Nep-null mice following DEP instillation.
Data expressed as mean ± SEM (N = 7). Letter “a” indicates significantly higher compared with the wild-type control group; “b” indicates significantly higher compared with Nep-null control group; and “c” indicates significant difference between wild-type and Nep-null mice with the same dose of DEP (P < 0.05). The DEP exposure was meant to approximate an accumulated dose of 7 days.

