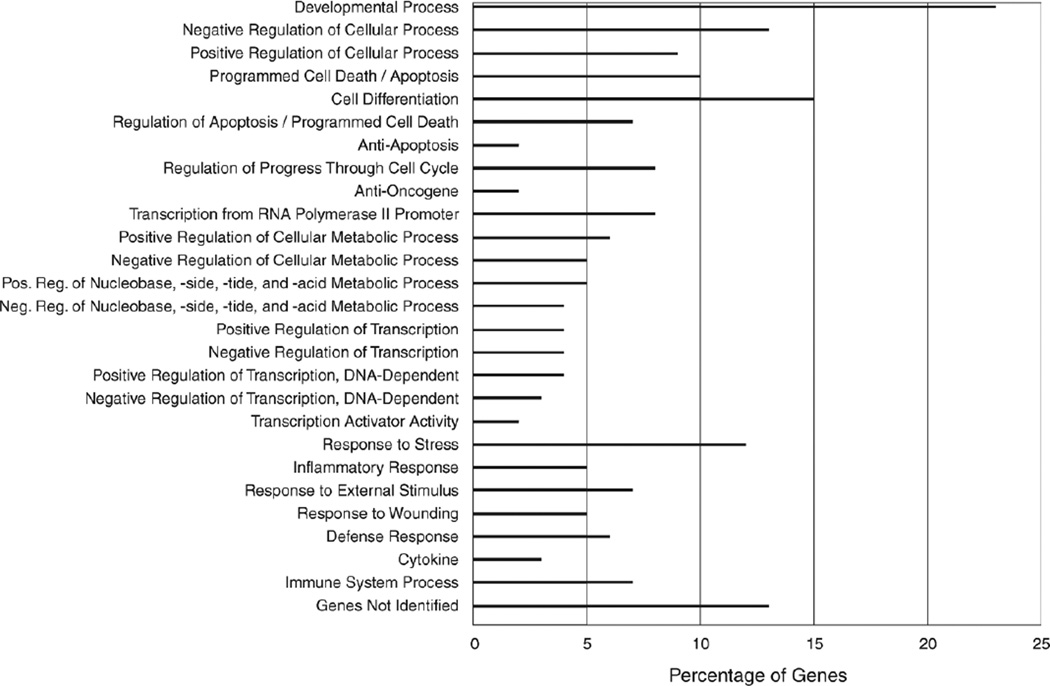
Figure 10. Functional annotation clustering of changed genes in BEAS-2B cells following DEP exposure.
Cells were treated with 0, 10, 40 µg/cm2 DEP for 24 hours. Categories of mode of action are represented on the y-axis according to the GO category of cell function (DAVID database). The bars in the histogram indicate the percentage of genes in each category that were up- or downregulated in a dose-dependent manner.

