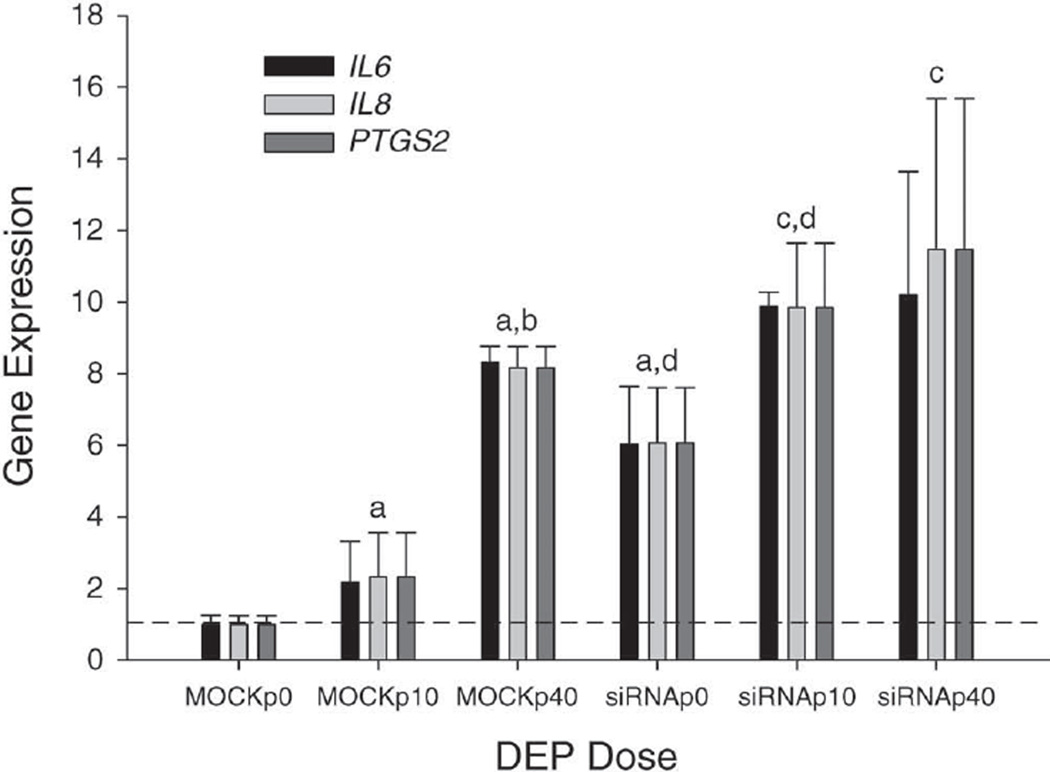
Figure 8. Confirmation of selected upregulated genes (normalized to MOCKp0) either by DEP exposure (0, 10, or 40 µg/cm2) or by NEP knockdown using RT-PCR.
Total RNAs isolated from BEAS-2B cells were the same as those of the microarray analyses. Comparisons are as follows: a and b indicate significantly higher compared with the MOCKp0 and MOCKp10 groups, respectively; c indicates significantly higher compared with the siRNAp0 group; and d indicates a significant difference between siRNA and MOCK groups with the same level of DEP (P < 0.05).

