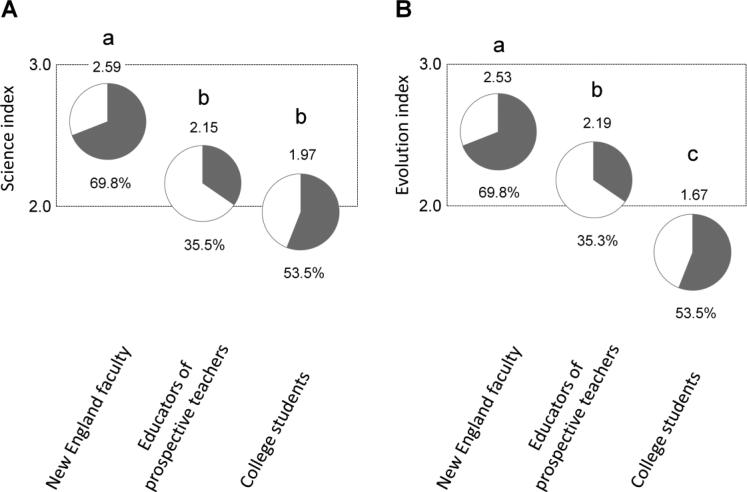
Figure 4.
Understanding of science and evolution as percentile of the non-religious members of three distinct populations: New England research faculty, educators of prospective teachers in the U.S., and New England college students. Gray areas in circles correspond to the percentage of the non-religious in respect to the total number of individuals surveyed within groups. The center of each circle is aligned with the level of understanding science (Science index) or the level of understanding evolution (Evolution index), values on the vertical axis, as in Fig. 2. (A) Science index: Kruskal-Wallis one-way ANOVA on ranks, H = 57.256, df = 2, P ≤ 0.001. (B) Evolution index: Kruskal-Wallis one-way ANOVA on ranks, H = 114.006, df = 2, P ≤ 0.001. Lowercase letters indicate Dunn-test two-tail pair-wise comparisons within groups P ≤ 0.05. New England research faculty n = 155, educators of prospective teachers n = 146, New England college students n = 308. The total number of responders per group can vary because participants in the surveys were allowed to skip questions or end survey voluntarily at any time.
Source: Modified from Paz-y-Miño-C and Espinosa 2014b.

