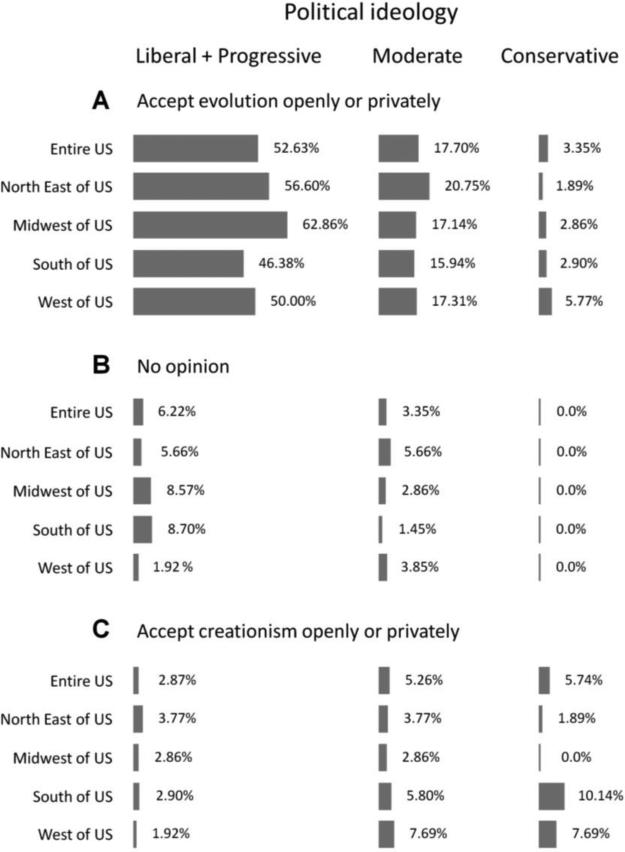
Figure 7.
Acceptance of evolution or creationism by educators of prospective teachers who self-defined their political ideology, U.S. Comparisons among groups: (A) accept evolution openly or privately: Chi-square = 4.051, df = 8, P = 0.852; (B) no opinion: Chi-square = 7.144, df = 4, P = 0.128; (C) accept creationism openly or privately: Chi-square = 9.844, df = 8, P = 0.276. Liberal + progressive n = 129, moderate n = 55, conservative n = 19, other n = 6 (details not shown); entire U.S. n = 209, North East of U.S. n = 53, Midwest of U.S. n = 35, South of U.S. n = 69, West of U.S. n = 52. The total number of responders per group can vary because participants were allowed to skip questions or end survey voluntarily at any time.

