Figure 3.
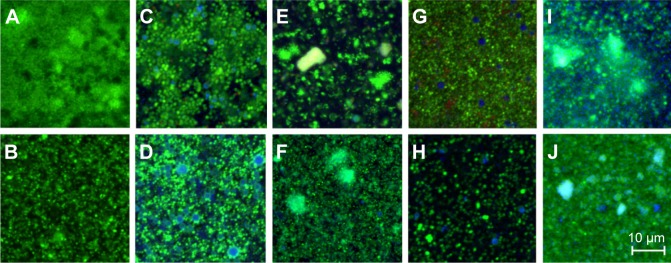
CLSM images of Burkholderia cepacia (A, C, E, G, I) and Staphylococcus aureus (B, D, F, H, J) biofilms.
Notes: The images represent biofilm sections located ~2 μm above the glass surface. The biofilms were treated for 4 hours with PBS (A and B), AMCA-PLGA MP (C and D), AMCA-PLGA NP (E and F), Chi-AMCA-PLGA MP (G and H), and Chi-AMCA-PLGA NP (I and J). Viable cells are visualized in green; dead cells are visualized in red; and MP and NP are visualized in blue. The scale bar on image J also applies to images A–H.
Abbreviations: AMCA-PLGA, 7-amino-4-methyl-3-coumarinylacetic acid-poly(d,l-lactide-co-glycolide); Chi, chitosan; CLSM, confocal laser scanning microscopy; MP, microparticles; NP, nanoparticles; PBS, phosphate buffered saline.

