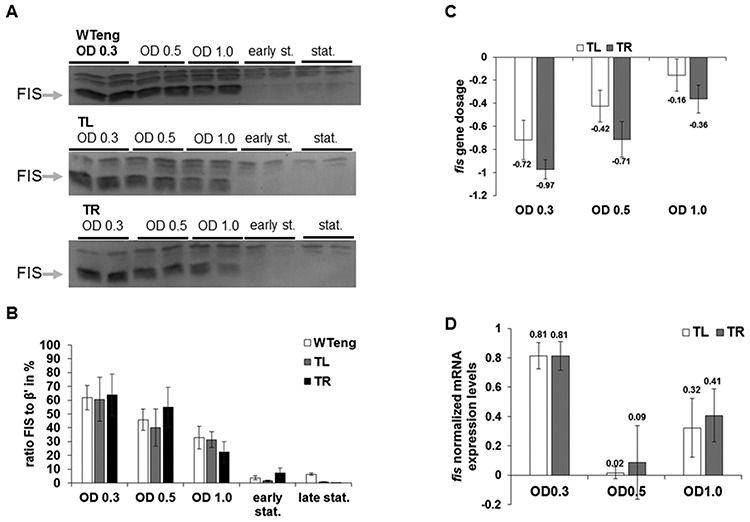
Figure 3.

The unaltered expression of fis in the movant strains is compensated. (A, B) Western blots showing FIS protein expression in WTeng, TL and TR strains (A) and the respective quantification (B), normalized to the β’ subunit of RNA polymerase. All quantifications were performed with AIDA software. In order to compare the western blots, the ratios to β’ were converted into percentages. (C) Determination of fis gene dosage in TL and TR strains during exponential growth phase. The values determined for WTeng serve as a baseline. The Y-axis represents the fis gene dosage in logarithmic (ln) scale, such that a value of −1.0 entails a 2-fold decrease compared to the baseline. (D) fis mRNA expression levels recorded during exponential phase with WTeng serving as a baseline. The Y-axis represents fis expression in logarithmic (ln) scale, therefore a value of +1.0 means a 2-fold increase compared to the baseline. All error bars are standard errors.
