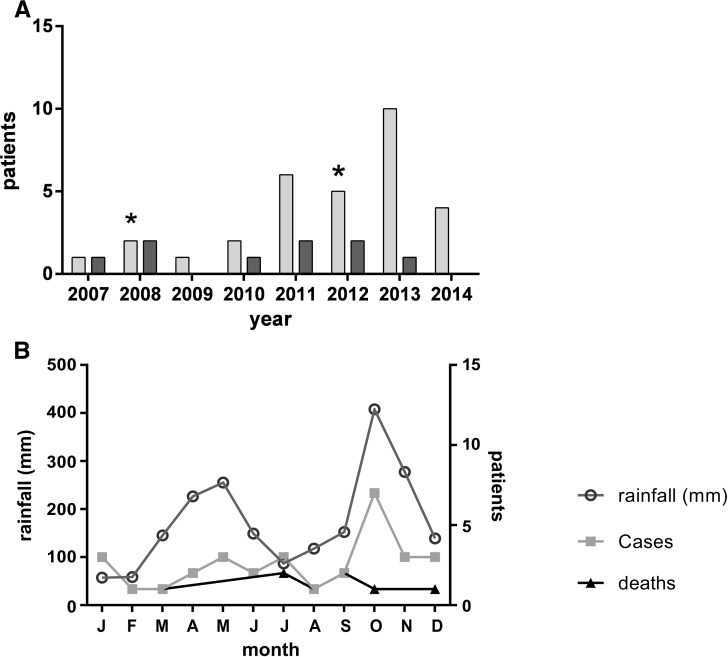
Figure 2.
Temporal distribution of invasive melioidosis in Sri Lanka. (A) Annual total of culture-positive melioidosis cases (light gray) showing decline in mortality (dark gray) during study (χ2 trend, 2 df, P = 0.02); * = World Health Organization training workshop. (B) Culture-positive melioidosis cases from 2006 to 2014 by month, superimposed on average monthly rainfall recorded near International Airport, showing correlation between peak monthly rainfall and case total (Pearson; r = 0.724, P = 0.008).

