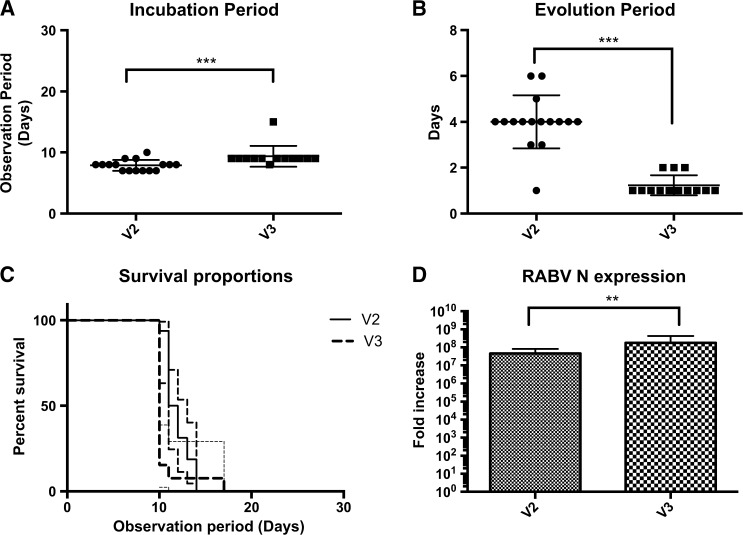
Figure 4.
(A) Incubation period of V2 and V3 groups (intracerebral route inoculation); Mann–Whitney two-tailed test showed a significant difference between the groups (*** P = 0.0002). (B) Evolution period of V2 and V3 groups; Mann–Whitney two-tailed test also showed a significant difference (*** P < 0.0001) between the groups. (C) Survival analysis curve between V2 and V3 within a 30-day observation period; Mantel–Cox test demonstrated a statistical significance between the two groups (** P < 0.01). (D) Relative rabies virus N gene expression between V2 and V3; Kruskal–Wallis test showed a higher expression in the V3 group (** P = 0.01).

