
Table 1.
Identification of 10 Novel hRRM1 Inhibitors Using in Silico Docking, Fluorescence Quenching, RR Inhibition Assays, and Growth Inhibition
| Structure | Docking scores (Schrödinger) | % Fluorescence quenching KD (μM) | Drug Effect (avg)a | RR IC50 (μM) | |
|---|---|---|---|---|---|
| (10 μM) | (1 μM) | ||||
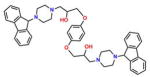 Compound 1 (PB-Piperazine) |
−7.68 | 15; 35.55 ± 3.57 | 0.880 | −0.396 | 23.9 ± 1.1 |
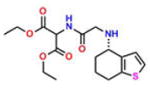 Compound 2 (tetraHThioDIM) |
−5.28 | 31; ND | 0.531 | −0.199 | 61.74 ± 1.5 |
 Compound 3 (S-DiTDB) |
−4.04 | 34; ND | 0.690 | 0.072 | 47.2 ± 2.1 |
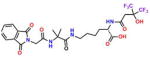 Compound 4 (OxoIsoIndoLys) |
−4.19 | 33; 9.68 ± 2.1 | 0.608 | 0.057 | 32.2 ± 1.3 |
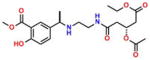
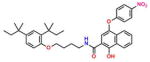 Compound 5 (ButHyNitNap) |
−4.67 | 30; ND | 0.398 | 0.038 | 21.8 ± 1.1 |
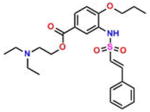 Compound 6 (DPSP) |
−5.28 | 50; 55.29 ± 8.25 | 0.043 | −0.033 | 44.0 ± 5.0 |
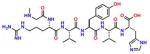 Compound 7 (NmetGAVTVH) |
−7.28 | 43; ND | 0.158 | 0.108 | 45.2 ± 1.2 |
 Compound 8 (BoPEAP) |
−4.67 | 35; 10.82 ± 1.86 | 0.036 | −0.076 | 23.6 ± 1.4 |
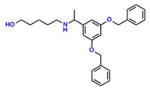
 Compound 9 (AEOHydBen) |
−5.84 | 29; ND | 0.096 | 0.098 | 27.2 ± 1.2 |
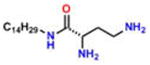
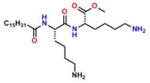 Compound 10 (MePAMLL) |
−5.69 | 32; ND | −0.089 | −0.219 | 35.7 ± 1.9 |
| Hydroxyurea (control) | NA | NA | NA | NA | 997 ± 0.11 |
a
Drug effect values are averaged from MDA-MB-231 and HCT116 cell lines. ND: KD’s not determined by fluorescence quenching due to the lack of sufficient quantities of the compound