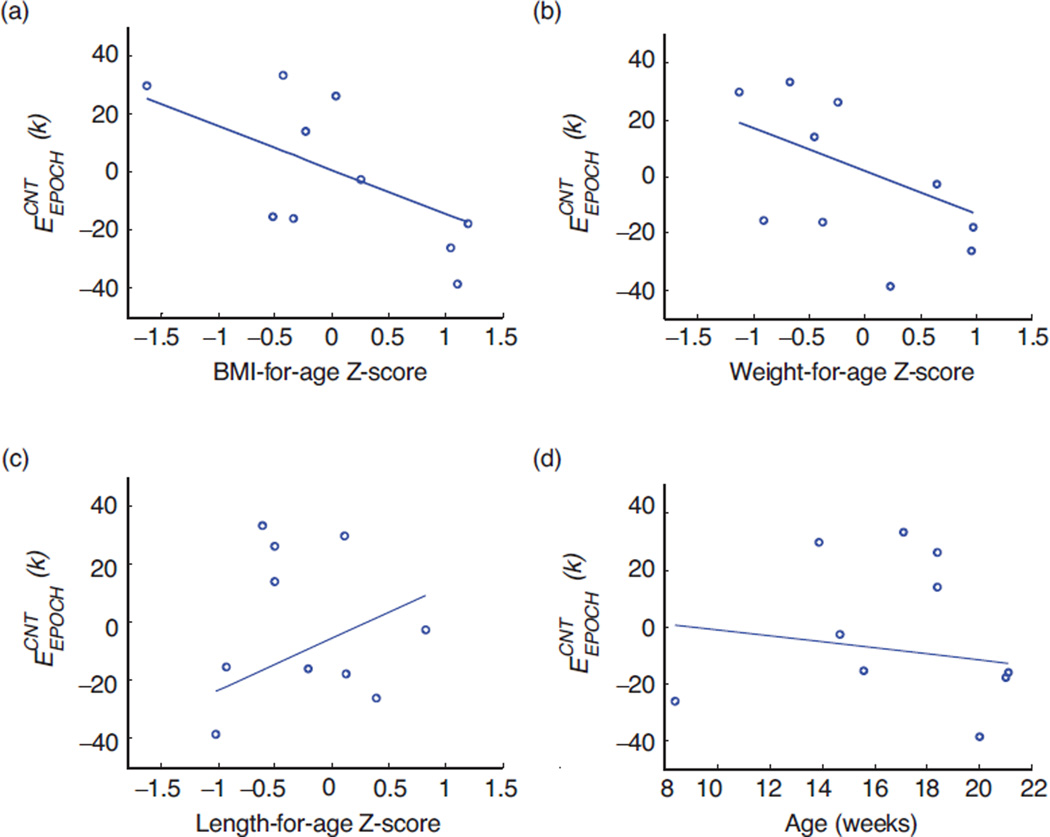
Figure 5.
(a) Passing-Bablok regression analysis for and BMI-for-ageZ-score. Regression line equation y = −0.01 – 0.15x; 95% CI is −0.06 to 0.06 for intercept and is −0.34 to 0.23 for slope. (b) Passing-Bablok regression analysis for and Weight-for-age Z-score. Regression line equation y = 0.02 – 0.15x; 95% CI is −0.02 to 0.03 for intercept and is −0.32 to 0.28 for slope. (c) Passing-Bablok regression analysis for and Length-for-age Z-score. Regression line equation y = −0.06–0.18x; 95% CI is −0.05 to 0.46 for intercept and is −0.1733 to 1.25 for slope. (d) Passing-Bablok regression analysis for and age (in weeks). Regression line equation y = 0.09 – 0.01x; 95% CI is −0.81 to 2.23 for intercept and is −0.12 to 0.05 for slope.

