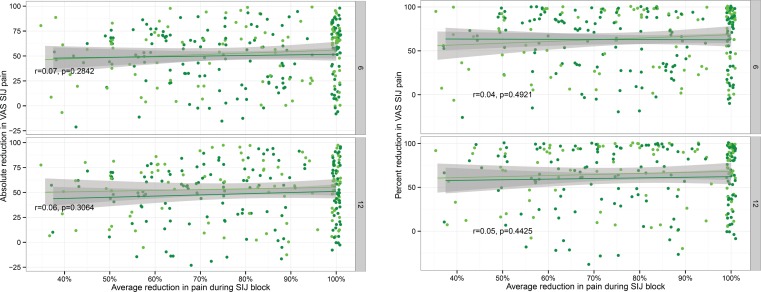
Fig. 2.
Six- and 12-month absolute (top) and relative (i.e., percent, bottom) improvement in VAS SIJ pain by average pain reduction during SIJB. Each dot represents an individual SIJF in INSITE (light green) or SIFI (dark green). Values are jittered slightly for visualization. Shaded areas represent 95% smoothed confidence intervals from linear regression. Plots show Pearson correlation coefficient combined across studies and associated p-values.

