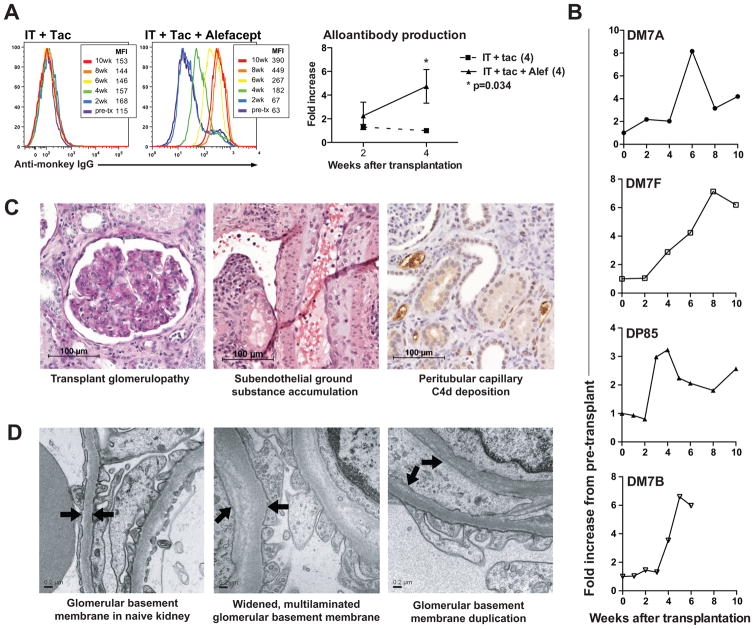
Figure 4. IT + Tac + Alefacept treated animals have increased alloantibody production and antibody-mediated tissue injury.
(A) IT + Tac treated animals failed to demonstrate alloantibody production. Four of four IT + Tac + Alefacept treated animals had donor-specific antibodies detected by 2–4 weeks after transplantation. (B) Alloantibody kinetics for all animals treated with IT + Tac + Alefacept are shown. (C) Transplant glomerulopathy was prevalent in this treatment group (left image, Periodic Acid Schiff stain, 200x). The space between the two black arrows indicates subendothelial ground substance, representing antibody-induced inflammatory changes (middle image, H&E stain, 200x). C4d deposition in peritubular capillaries was observed in some of the rejected grafts (right image, C4d stain, 200x). (D) The left image is an electron microscopy image of a naïve kidney, with the arrows indicating glomerular basement membrane. The middle image shows widening and lamination of glomerular basement membranes. The right image shows duplication of basement membranes, indicative of antibody-mediated injury.

