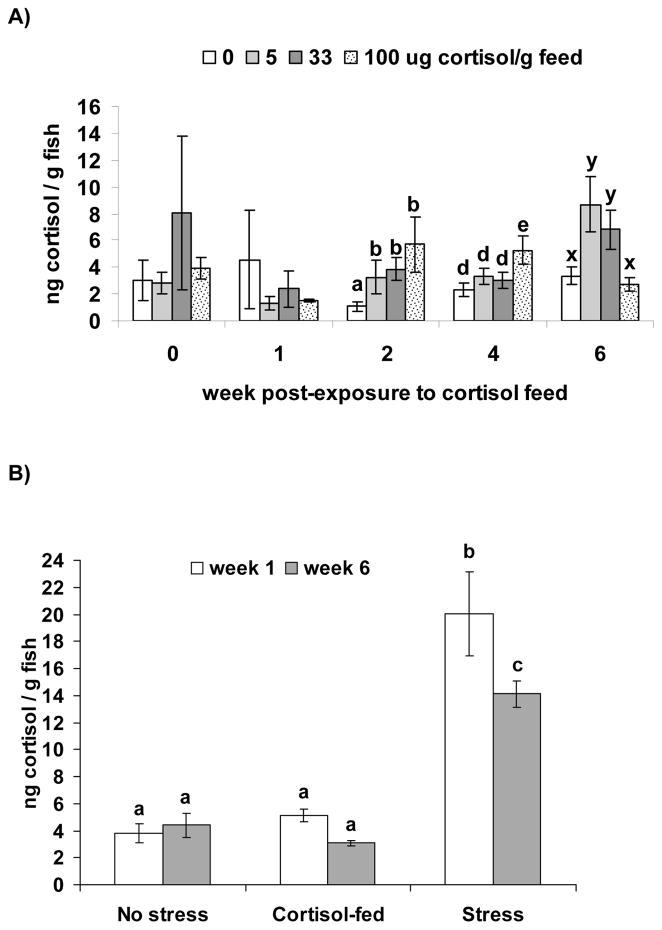
Figure 1.
Danio rerio Cortisol-dose Experiment (AB strain) A) Mean whole-body cortisol (ng · g−1; ± SEM) after feeding fish 0, 5, 33 and 100 μg cortisol · g feed−1 for 0, 1, 2, 4 and 6 wk. Different letter over the SEM bars indicate a significant difference between cortisol dose groups at each time post-exposure to cortisol feed (there were not significant differences between cortisol dose groups at wk 0 or 1 PE. B) Mean cortisol (ng · g−1; ± SEM) in groups exposed to no stress, cortisol-fed or exposed to stress for 1 or 6 wks. Different letters over the SEM bars indicate a significant difference between groups (p<0.05).

