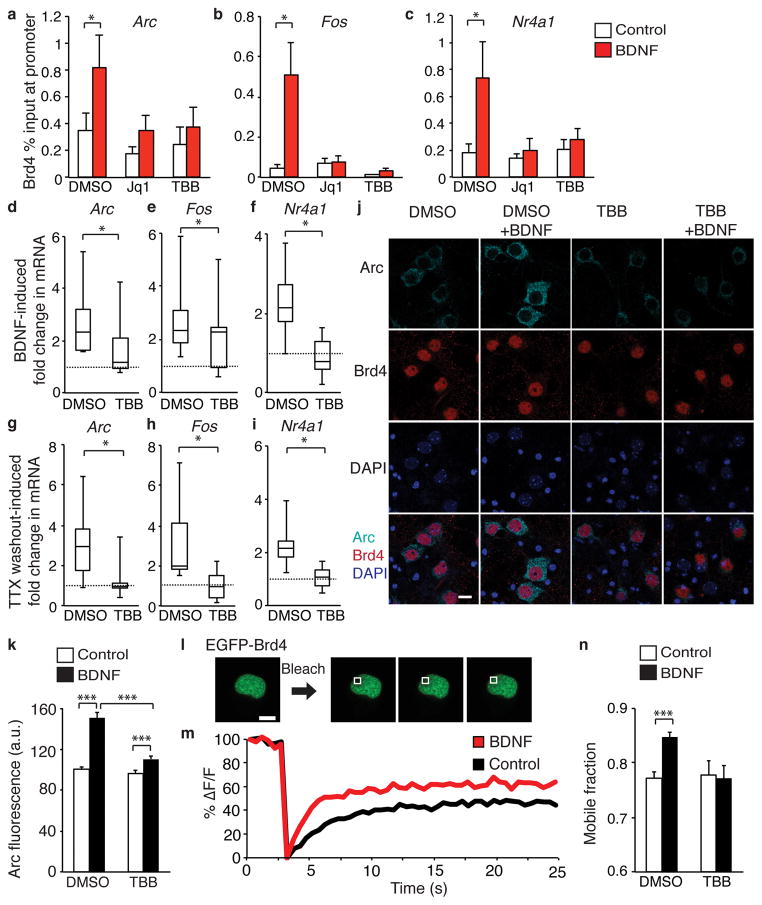
Figure 4. CK2 regulates Brd4 in neurons.
(a, b, c) Brd4 ChIP-qPCR analysis in cultured neurons pretreated with vehicle or CK2 inhibitor TBB and stimulated with BDNF for 10 minutes to measure Brd4 at promoters of Arc (a), Fos (b), and Nr4a1 (c) (paired two-tailed t test, for Arc dmso treatments n = 10 biological replicates, P = 0.00955, t = 1.693, for TBB treatments n = 6, and for Jq1, n = 3, for Fos n = 8 biological replicates, P = 0.0303, t = 2.791, for TBB n = 6 and for Jq1 treatments, n = 3, for Nr1A1, dmso treatments n = 9 biological replicates, P = 0.0411 t = 1.987, for TBB treatments n = 5, and for Jq1, n = 3). (d, e, f) TBB pretreatment blocks increased Arc (d), Fos (e), and Nr4a1 (f) mRNA after 10 minute BDNF stimulation. (paired two-tailed t test, for Arc n = 14 biological replicates, P = 0.0215, t = 2.505, for Fos n = 14 biological replicates, P = 0.0175, t = 2.496, and for Nr4a1 n = 13 biological replicates, P = 0.0122, t = 2.926). (g, h, i) TBB pretreatment blocks increased Arc (g), Fos (h), and Nr4a1 (i) mRNA 10 minute after TTX withdrawal (paired two-tailed t test, for Arc n = 8 biological replicates, P = 0.0451, t = 2.485, for Fos n = 8 biological replicates, P = 0.0179, t = 2.728, and for Nr4a1 n = 6 biological replicates, P = 0.0437, t = 2.983). (j, k) Arc and Brd4 staining (j) and quantification (k) after TBB or vehicle pretreatment and 30-minute BDNF stimulation. (unpaired two-tailed t test, for control n = 108 neurons, for BDNF n = 131, for TBB n = 117, for TBB+BDNF n = 118 from 2 biological replicates, for control vs bdnf P = 7.42E-14, t = 7.962, for TBB vs TBB+BDNF P = 0,001, t = 3.331, for BDNF vs TBB+BDNF P = 7.598E-10, t = 6.408). (l, m) Example of images (l) and recovery curves (m) for FRAP of EGFP-Brd4 expressed in neurons. (n) Mobile fraction quantification of EGFP-Brd4. (unpaired two-tailed t test, for control n = 120 neurons, for BDNF n = 113, for TBB n = 39, for TBB+BDNF n = 50 from 6 biological replicates, P = 9.98E-7, t = 5.02). *, p<0.05. ***, p<0.001. a.u. arbitrary units. s, seconds. Error bars represent standard error. Scale bar is 10 μM.

