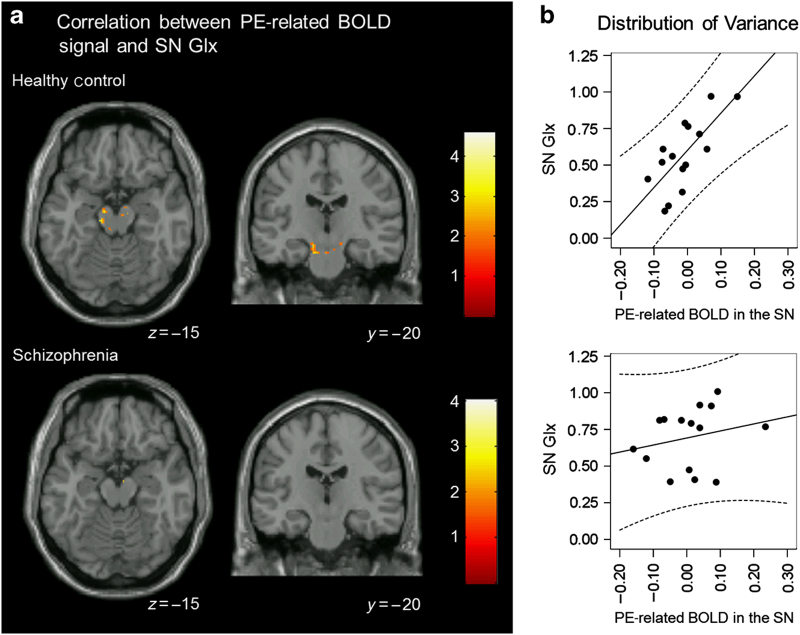
Figure 4.
Correlation between PE-related BOLD signal and SN Glx. (a) In healthy controls, but not in patients with schizophrenia, there was a significant correlation between PE-related BOLD signal and SN Glx in the SN (analyses restricted to ventral striatum and midbrain/SN using small-volume correction; P<0.05). Clusters are overlaid on a single-subject T1 structural image. The numbers adjacent to the slices indicate y and z coordinates in Montreal Neurological Institute convention for coronal and axial slices, respectively. BOLD, blood oxygen level dependent; Glx, glutamate+glutamine; PE, prediction error; SN, substantia nigra. (b) Scatterplots showing the distribution of variance in the relationship between Glx and PE BOLD response in healthy controls (r=0.74) and patients with schizophrenia (r=0.30).

