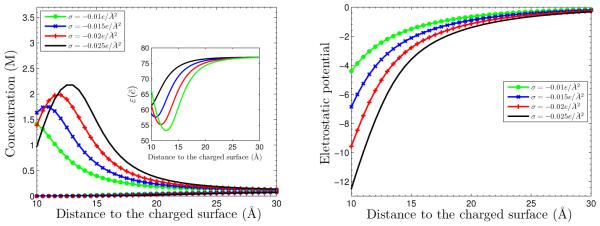
Fig. 5.3.
System I with . Left: The ionic concentrations vs. the radial distance to the charged surface. The four counterion concentration profiles for the four different values of the surface charge density are indicated by the symbols. The four corresponding coion concentrations overlap and become one curve which is the lowest one. Right: The electrostatic potentials vs. the radial distance to the charged surface for different values of the surface charge density.

