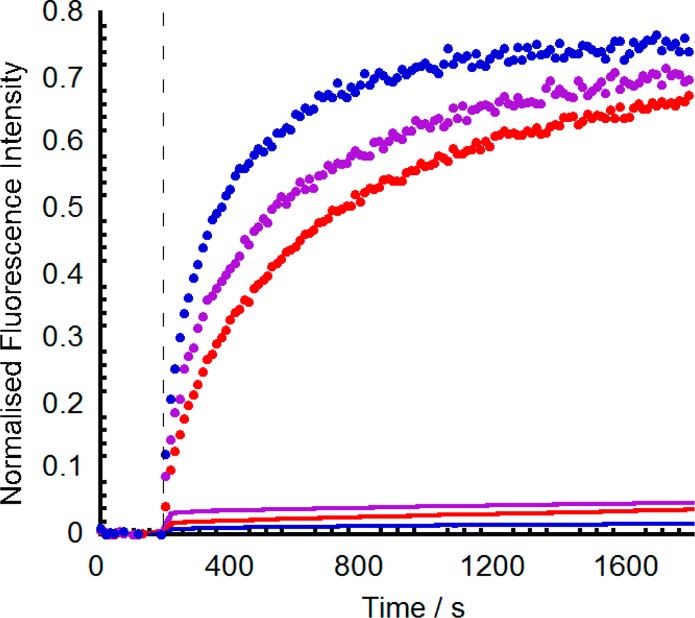
Figure 5.

Co-plot of normalized HPTS ion transport data (●) and 5/6-CF release data (—) for 3 (Aib7, 10 μM, red), 7 (Aib11, 0.6 μM, blue), and 9 (Aib13, 0.6 μM purple). Additions of foldamer solution in methanol to LUVs (20% cholesterol/EYPC, 0.76 mM lipid, 2 mL) at 0 s (HPTS data, base pulse at 180 s) or 180 s (5/6-CF data).
