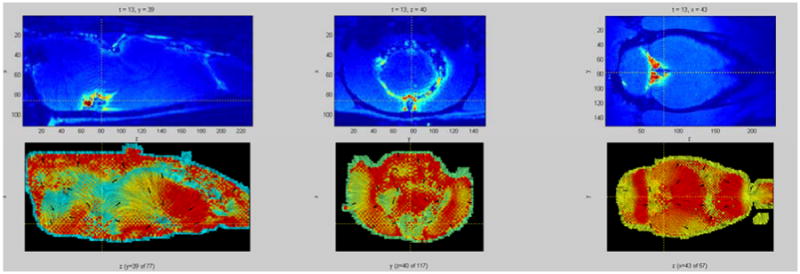
Figure 3.

Top row: y, z, and x slices of a rat brain at a given time with color showing the concentration of a tracer (red – high concentration, blue – low concentration). Bottom row: Tracer flow through the respective slices depicted in the top row, presented as a LIC (Line Integral Convolution) image. Intensity lines are tangential to the computed flow direction over the slice, with arrows pointing in the actual flow direction. The color information depicts the strength of the flow component that is tangential to the slice plane (red – strong tangential component, i.e. the flow vector mostly lies within the slice plane; blue – weak tangential component, i.e. the flow vector is orthogonal to the slice plane). Most of the flow estimate agrees with the current understanding of the brain-wide glymphatic transport patterns (i.e. validated by optical imaging experiments). In some areas the estimate failed because the tracer has not reached them during the simulation time, therefore, the computation was mostly affected by the regularization (smoothness term) and not by the data.
