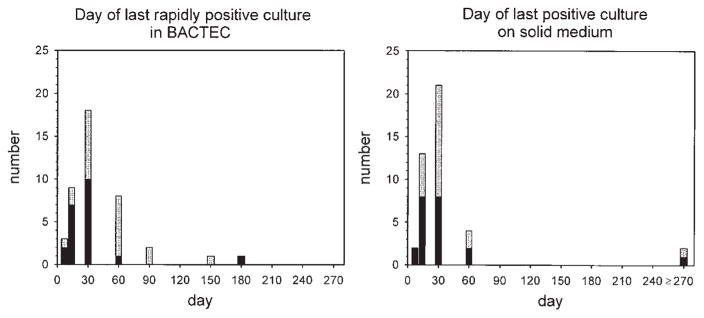
Figure 1.
Frequency distributions of day of last rapidly positive culture in BACTEC (indicating mycobacterial growth within 20 d of inoculation (left panel) and that of the day of last positive culture on solid medium (right panel). Subjects from Uganda are indicated in gray; those from Brazil are indicated in black. The two rightmost subjects in both graphs represent relapses.

