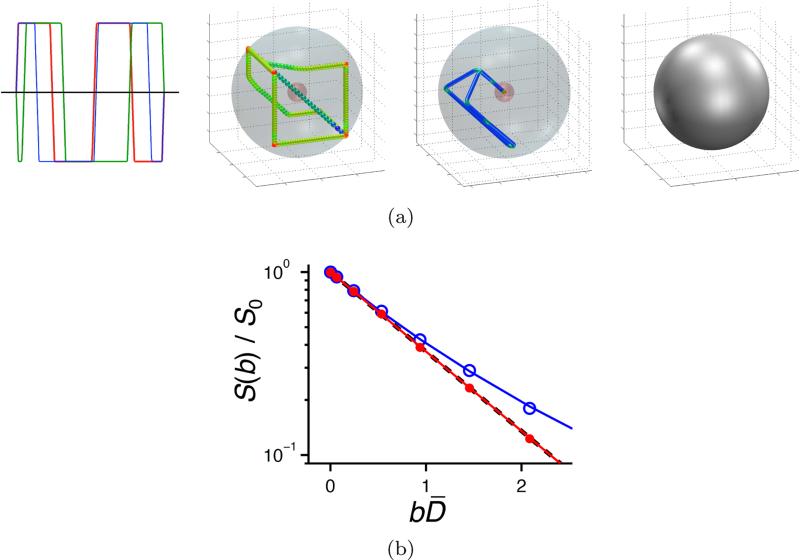
Figure C.10.
(a) Waveform optimized to achieve isotropic diffusion encoding for an NMR experiment. See caption of figure 4 for figure details. (b) Normalized signal E(b) = S(b)/S0 vs. normalized diffusion weighting bD̄ for a representative pixel in an NMR experiment on a water/surfactant mixture. Powder-averaged measurements are shown with open blue circles, the measurements using the optimized waveform are shown with solid red circles. The blue and red lines show the corresponding fits of equation (C.3). The dashed black line is the single-exponential E(b) = e−bD̄. The overlapping of the solid red and dashed black lines shows that the optimized waveform achieves the expected encoding.

