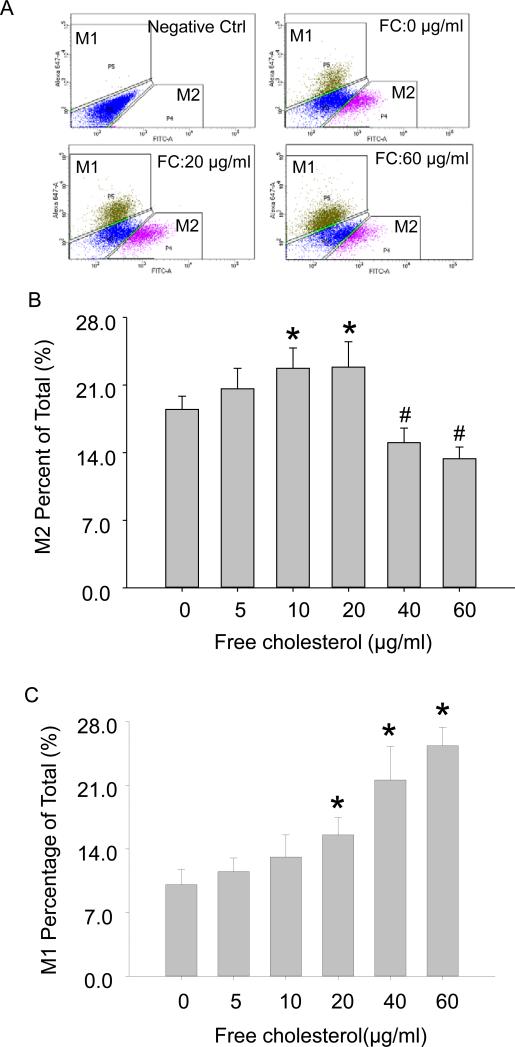
Figure 4.
Distinguishing M1 and M2 polarization upon free cholesterol loading by fluorescence-activated cell sorting (FACS). A: FACS diagram of polarized M1 and M2 subgroup macrophages. B: Summarized FACS results showed that M2 activation was increased at lower concentrations of free cholesterol but markedly reduced at higher concentrations. C: M1 activation experienced significant increases with the application of higher free cholesterol concentrations. (P<0.05, *: vs. 0 group, #: vs. 20 μg/ml group, n = 6).

