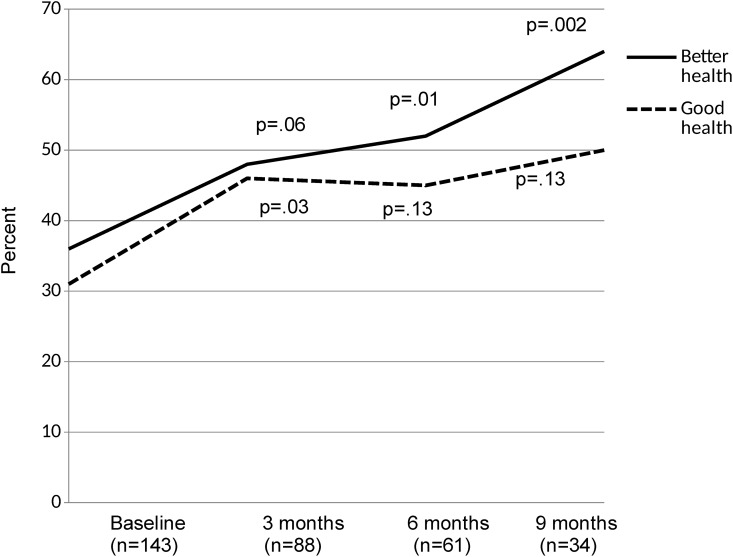
Fig 4. Changes in Self-Rated Health in Care Support Patients Over Time.
The percentage of patients who self-reported good health (defined as good, very good or excellent versus fair or poor) is shown in red, while the percentage of patients who self-reported that their health was better than 3 months ago (defined as somewhat or much better versus about the same, somewhat worse or much worse) is shown in blue. P-values are based on McNemar’s test for paired proportions compared to baseline values.

