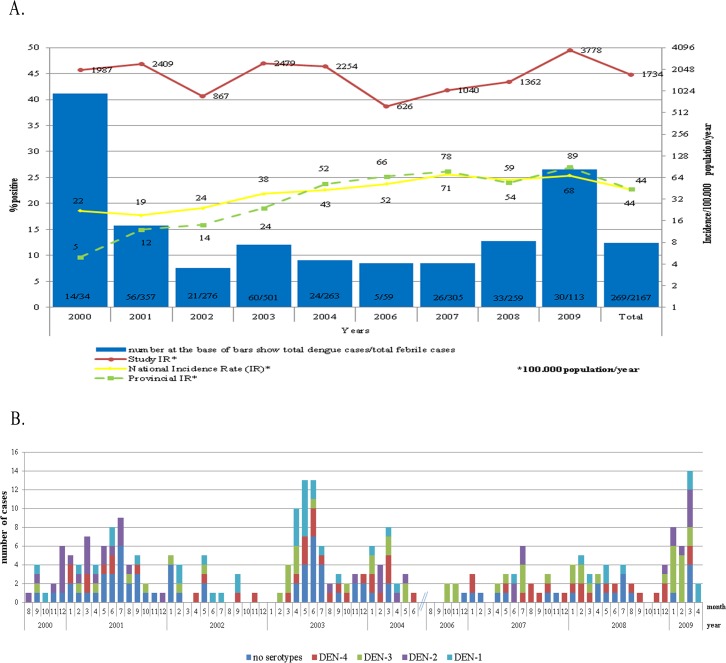
Fig 2. Dengue cases by year, month and serotype distribution, 2000–2004 and 2006–2009.
A. Proportion of dengue virus infections among febrile episodes by year (grey bars), incidence rate of dengue virus infections in the cohort (red line), national incidence rate (solid black line) and provincial incidence rate (dashed black line). B. Monthly distribution of dengue cases by serotype.

