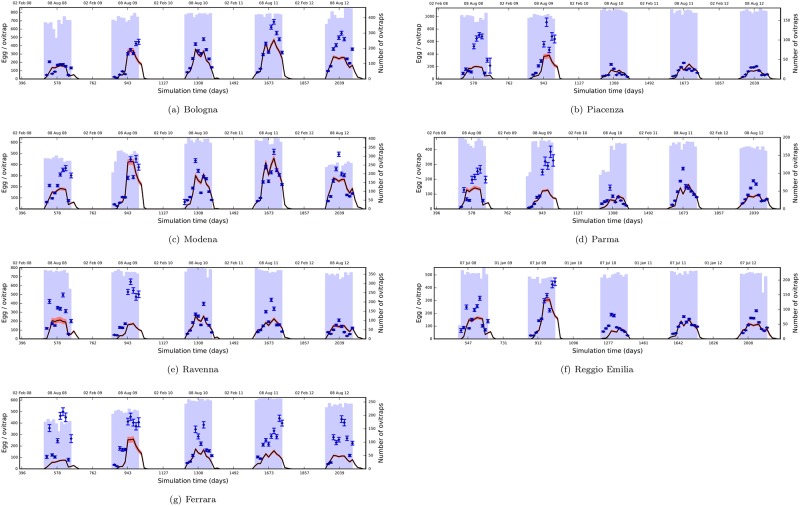
Fig 3. Performance evaluation against the surveillance data from Emilia-Romagna.
Blue diamonds represent average egg counts per ovitrap, and vertical error bars represent the standard error of the mean. They are positioned at the dates of data collection along the horizontal axis. Blue bars in the background indicate the number of ovitraps covering a period of two weeks prior to each collection. Solid black lines show model output using the parameters from Θ1 (see text). Red shades represent the 95% confidence interval.

