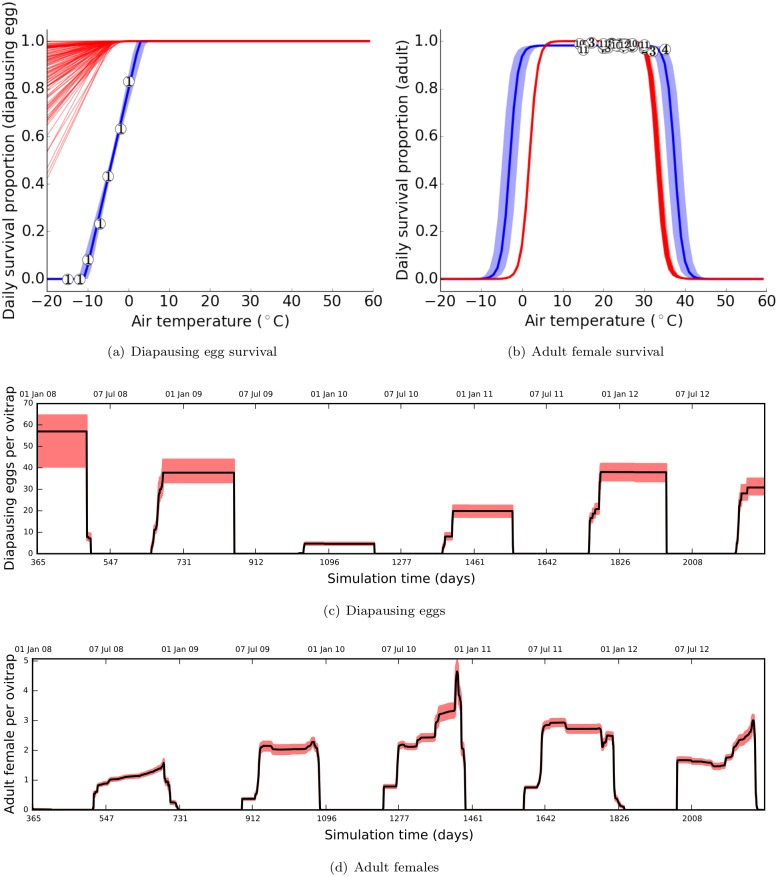
Fig 5. Cold resistance for adults and diapausing eggs with Θ1.
Prior (blue) and posterior (red) distributions of diapausing eggs (a) and adult females (b) are shown with data from literature (numbered circles). The prior distribution is represented by a solid line (mean) and a shaded region (95% confidence interval). The posterior distribution is represented by 100 samples drawn from the posterior mode Θ1. Daily average diapausing eggs (c) and adult females (d) per ovitrap are simulated with Θ1. The solid line represents the mean and the red shade represents the 95% confidence interval. (a) 1: [52], (b) 1: [71], 2: [72], 3: [58], 4: [46], 5: [73], 6: [74], 7: [75], 8: [76], 9: [77], 10: [78], 11: [79], 12: [80].

