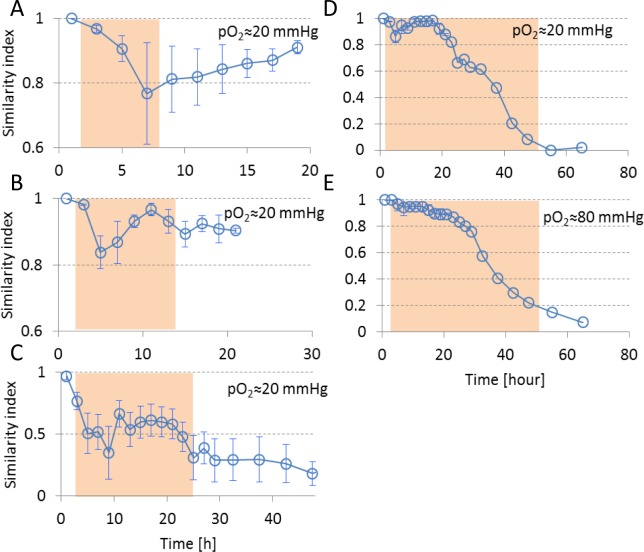
Fig 4. Temporal evolution of similarity index (Eq 2) before, during, and after hypoxia.
Average values are shown for 2 hour time bins. Errorbars indicate SEM and reflect differences between cultures. Filled backgrounds mark the hypoxic (pO2≈20 mmHg or pO2≈80mmHg) period.

