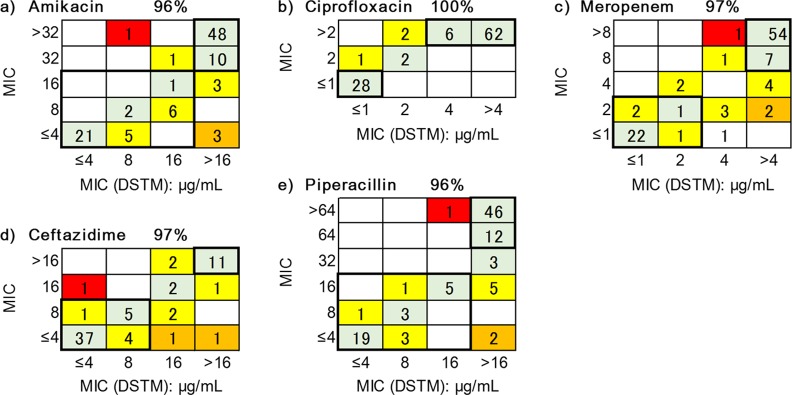
Fig 9. Correlation between MICs from the DSTM method and the microbroth dilution method in Pseudomonas aeruginosa.
Domains in the bold-lines indicate sensitive or resistant (categorized by the breakpoints of CLSI) using both methods. Green shade, matching; yellow shade, 2-fold difference; orange and red shade, >4-fold difference. Red shade indicates very major errors. The matching ratios (%) shown for each drug contain 2-fold differences.

