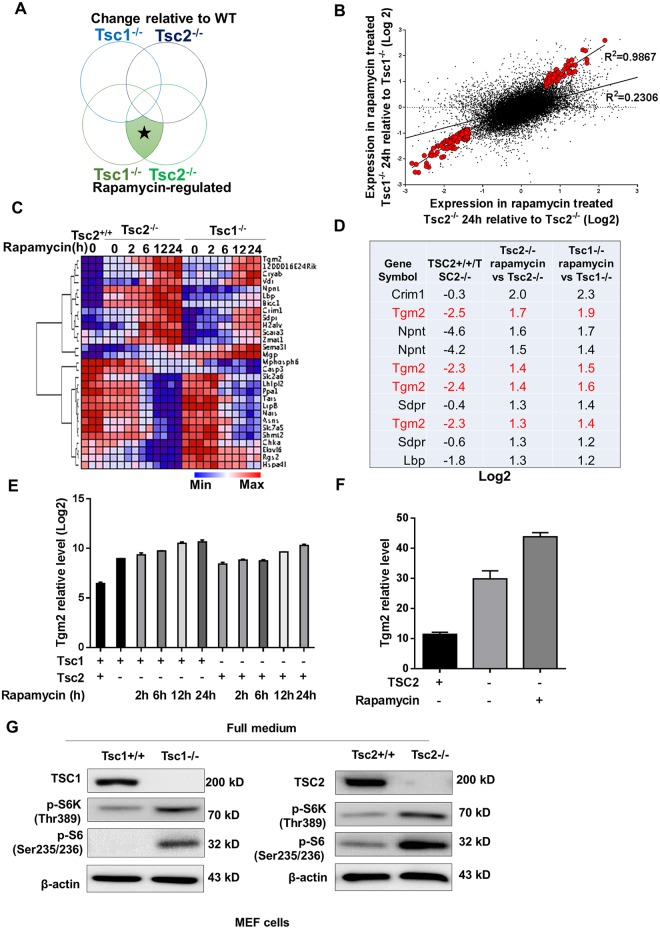
Fig 1. Rapamycin regulates Transglutaminase 2 in Tsc2−/− MEFs.
(A) Hypothetical Venn diagram of the two major changes in gene expression observed in this study. Rapamycin-regulated transcripts were classified as those that met all four criteria at a statistical cut-off *p < 0.01. (B) Scatter plot of the expression levels (log2) of the 39,000 probed genes comparing rapamycin- and vehicle-treated Tsc2-/- cells (x-axis), and rapamycin- and vehicle-treated Tsc1-/- cells (24 h) (y-axis). The larger red dots indicate the expression pattern of the 29 gene probes meeting the criteria described in (A). The gray dots indicate the expression pattern of the entire dataset. (E) Heat map of the 29 rapamycin-regulated probes identified in this study showing their expression levels and regulation in response to rapamycin over time in WT, Tsc2-/- and Tsc1-/- cells. The expression levels are representative of the log2 value per sample. (D) Top 10 probes of rapamycin-regulated genes as well as those that were not reverted towards wild type levels by rapamycin treatment in TSC1 and TSC2-deficient cells. (E) Tgm2 transcript levels were compared among WT, Tsc2-/- and Tsc1-/- cells using the log2 values from the GSE21755 GEO dataset. (F) Tgm2 transcript levels were compared between TSC2-deficient (TSC2-) and TSC2-addback (TSC2+) cells, and rapamycin- and vehicle-treated TSC2-deficient cells (Rapa+ TSC2-) from the GSE16944 GEO dataset. (G) Immunoblots of TSC1, TSC2, phospho-S6 and phospho-p70 S6K in Tsc1+/+, Tsc1-/-, Tsc2+/+ and Tsc2-/- MEF cells. All data are shown as means ± S.D. ** P < 0.01, *P < 0.05, Student’s t-test.

