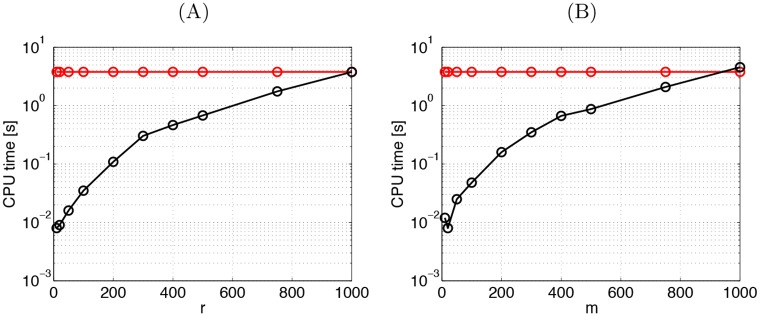
Fig 2. Average computational cost of REKEMA and rKEMA.
CPU time [s], over 10 realizations as a function of r and m for the (A) reduced rank KEMA (REKEMA) and (B) randomized KEMA (rKEMA) in black lines. In both figures, the red line is the KEMA solution). We used synthetic example ♯1 (see experiments section) with n = 1000 samples.

