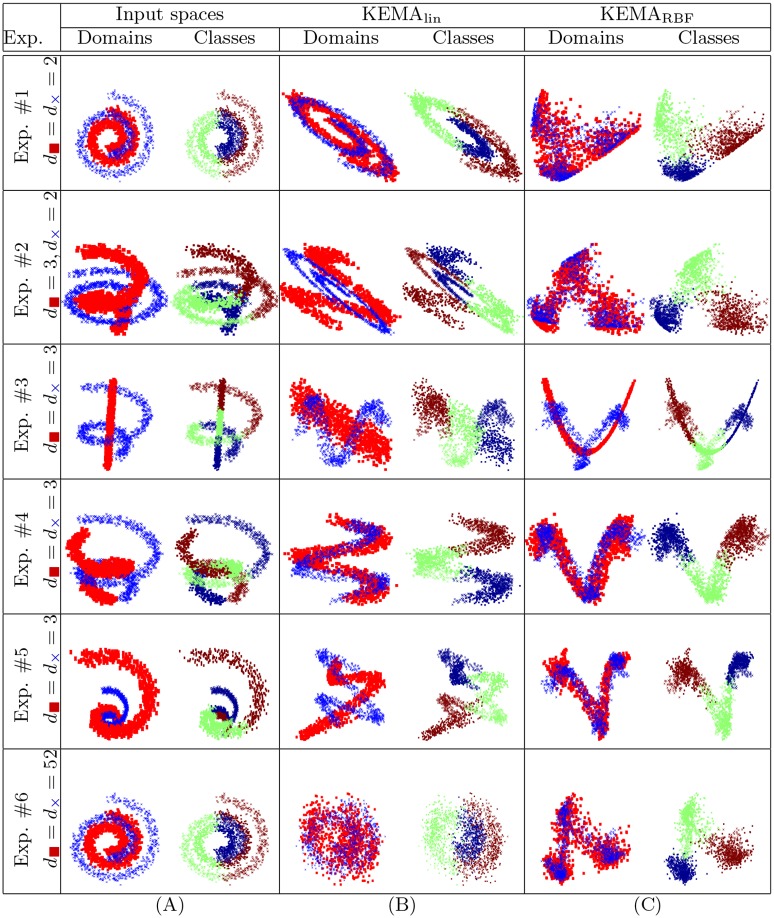
Fig 3. Illustration of linear and kernel manifold alignment on the toy experiments.
(A) data in the original domains (X1 is designated with red squares, X2 is designated with blue crosses) and per class (red, green and blue circles, respectively), data projected (B) with the linear and (C) the RBF kernels.

