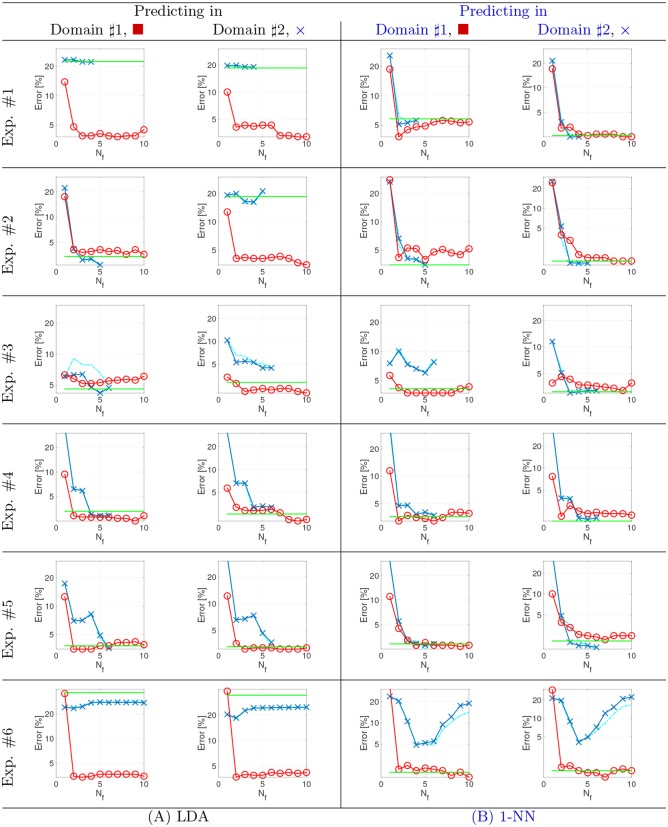
Fig 4. Classification performances on the toy examples.
Error rates as a function of the extracted features (Nf) when predicting data for the first (left inset) or the second (right inset) domain. In all plots KEMALin is in blue, KEMARBF in red, SSMA in cyan and the Baseline in green. Panel (A) shows the LDA results, panel (B) the 1-NN.

