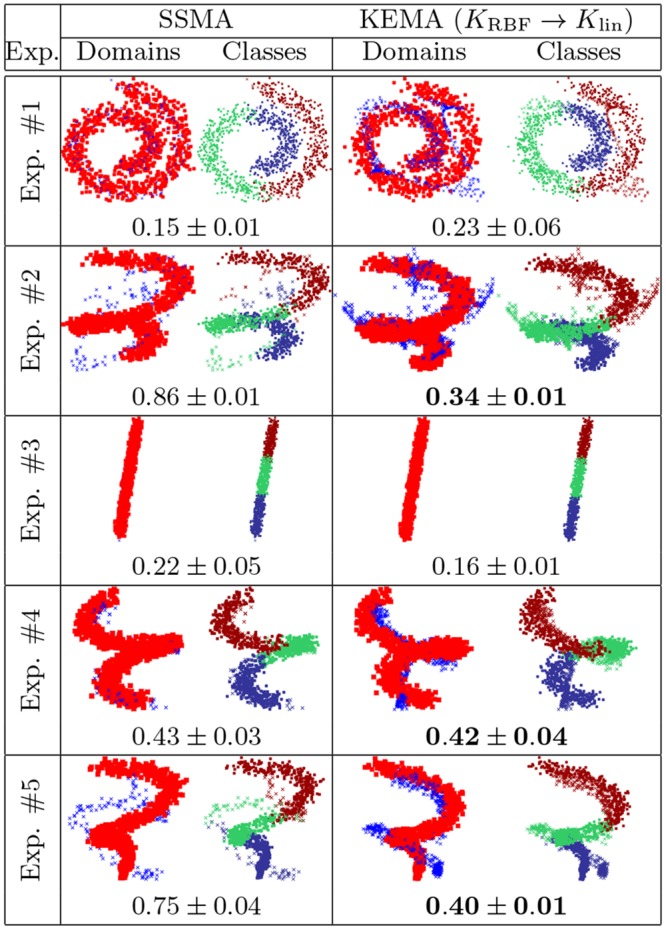
Fig 6. Domain inversion with SSMA and KEMA.

For each panel, the left inset represents domains: the red squares are samples in the source domain, while the blue crosses are target domain samples projected onto the source domain. The right inset represents the three classes (red, green and blue circles). Each plot shows the result of a single run, and the averaged ℓ2-norm reconstruction error over 10 runs.
