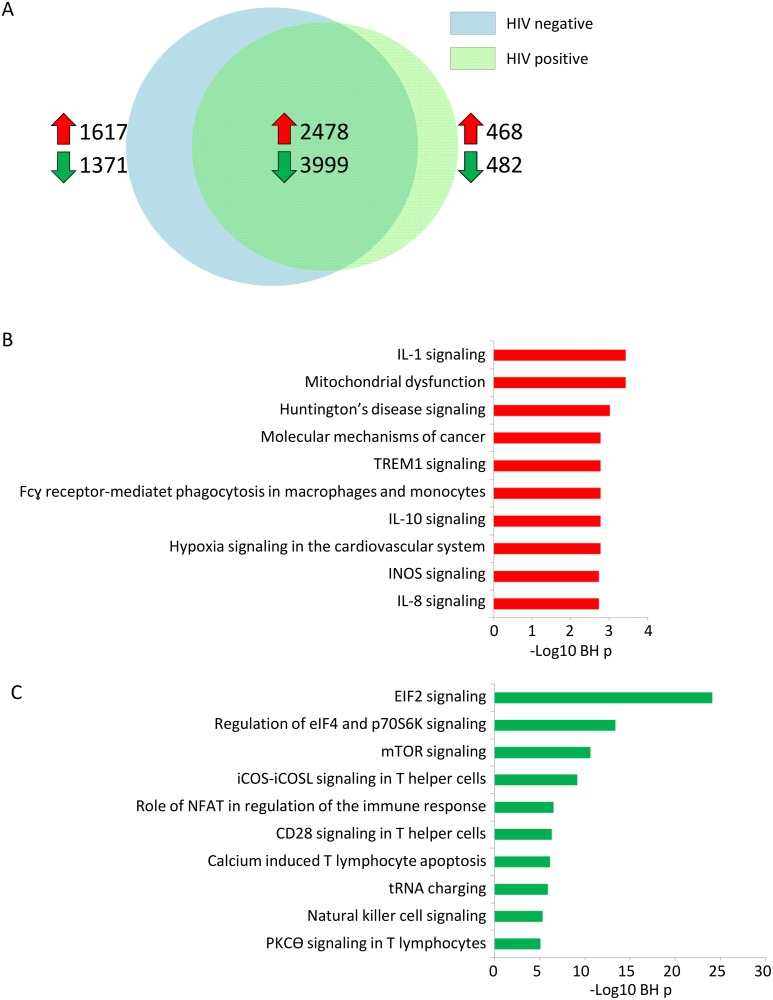
Fig 1. Genomic response to sepsis compared to healthy controls demonstrate a predominantly common host response in sepsis patients with or without HIV infection.
(A) Venneuler plot depicting differentially expressed genes between HIV positive and HIV negative sepsis patients as compared to healthy controls. Red and green arrows indicate the number of overexpressed and underexpressed genes, respectively. (B) Top 10 canonical signaling pathways significantly associated with commonly over-expressed genes (n = 2478). Abbreviation:–log (BH) p: negative log10 transformed Benjamini-Hochberg adjusted Fisher’s exact p value. (C) Top 10 canoncical signaling pathways significantly associated with commonly under-expressed genes (n = 3999). Abbreviation:–log (BH) p: negative log10 transformed Benjamini-Hochberg adjusted Fisher’s exact p value.

