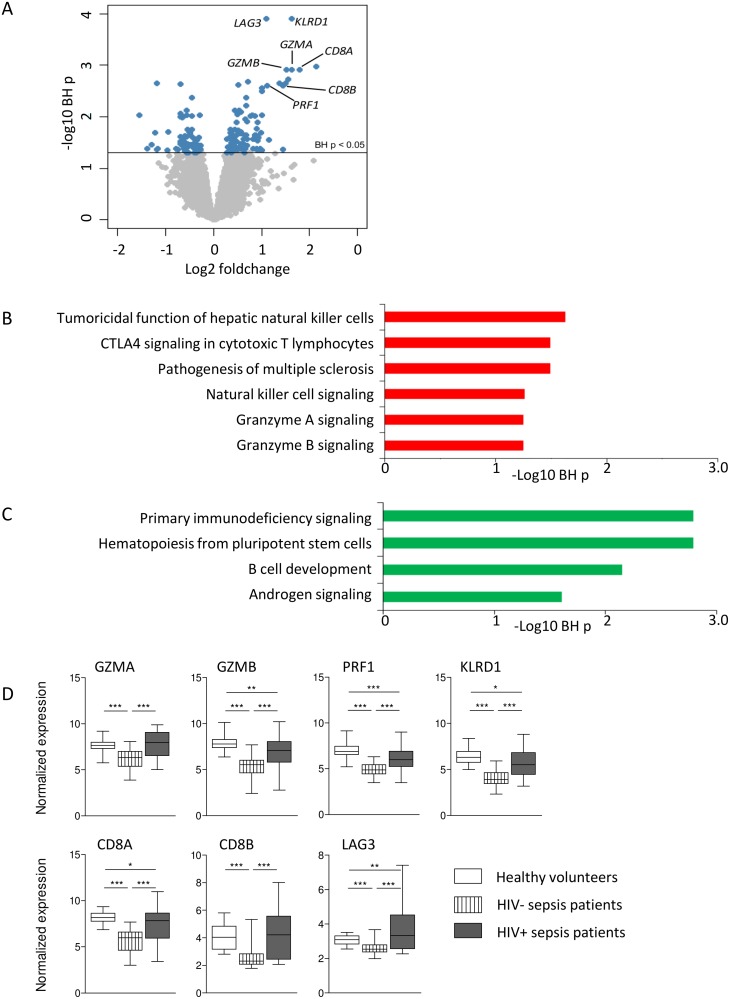
Fig 2. Differential gene expression analysis of HIV positive compared to HIV negative sepsis patient samples in the genomic response cohort reveal differential expression in several canonical pathways.
(A) Volcano plot representation (integrating log2 foldchange and multiple comparison adjusted p values) of differential gene expression comparing HIV positive and HIV negative sepsis patients. Horizontal line denotes the multiple comparison adjusted significance threshold (Benjamini-Hochberg (BH) p < 0.05). 149 unique genes were significantly differential (blue dots). (B) Over-expressed genes in HIV positive sepsis patients, as compared to HIV negative sepsis patients, associated to six canonical signaling pathways. Abbreviation:–log (BH) p: negative log10 transformed Benjamini-Hochberg adjusted Fisher’s exact p value. (C) Under-expressed genes in HIV positive sepsis patients, as compared to HIV negative sepsis patients, associated to four canonical signaling pathways. Abbreviation:–log (BH) p: negative log10 transformed Benjamini-Hochberg adjusted Fisher’s exact p value. (D) Expression of prominent genes in pathways differentially expressed between HIV positive and HIV negative sepsis patients. Data are depicted as box- and whisker plots depicting the smallest observation, lower quartile, median, upper quartile and largest observation. * = p<0.05, ** = p<0.01, *** = p<0.001.

