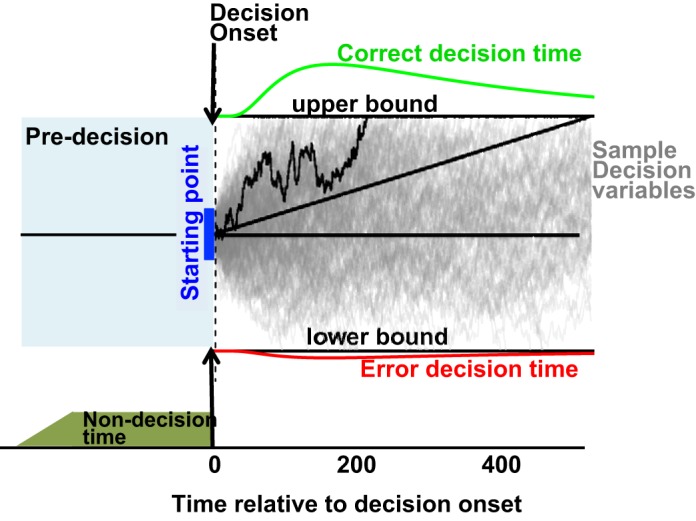
Fig. 1.

Drift-diffusion model. The drift-diffusion model views decision making as the integration of differential evidence to 1 of 2 response bounds. Thin gray lines represent sample traces of the decision variable in different simulated trials. A decision process ends as soon as the decision variable reaches 1 of the 2 bounds. Thin black line highlights 1 example trace that reaches the correct (upper) boundary ∼220 ms after integration onset. Green and red curves above and below the upper and lower bound represent the distribution of decision times for the correct and wrong choices. The total reaction time is defined as the sum of decision time and non-decision time. Solid blue vertical bar at time 0 represents the distribution of the decision variable at the time of integration onset. Straight black line emerging from the origin represents mean path of the decision variable in the absence of absorbing boundaries.
